Industry Trends: Beverage 5/8/2017
Quick Sips:
- Sodas, energy drinks, sports drinks, tea, and other items, account for more than 80% of the US nonalcoholic beverage market. Bottled water accounts for 15%.
- Beverage manufacturers and bottlers typically have gross margins of about 30% to 40% of net sales.
- In the soft drink industry, carbonated soft drinks account for about 65% of industry revenue, while noncarbonated beverages make up about 35% *Hoovers
- Per capita soft drink consumption in the U.S. is 41 gallons per person
- 28% of consumers are daily soft drink consumers *Statista
Hot Segments:
Cold Coffee (bottled)
Bloomberg writes, “Coffee makers from global giants JAB and Illy to smaller upstarts such as High Brew, La Colombe and Chameleon Cold-Brew are putting their brews on ice. They’re introducing high-end ready-made chilled bottled and canned coffee, betting U.S. grocery shoppers will embrace yet one more way to get their caffeine jolt. Coca-Cola, Dr Pepper and other beverage makers are jumping in. And a Starbucks-PepsiCo partnership, which has long dominated packaged cold coffee, is also introducing new chilled brews.”
Probiotics/Kombucha
Probiotics broadly refers to the positive microorganisms in the human body that aid in digestion and general gut health. According to research firm MarketsandMarkets, the larger digestive health ingredients market in the US was projected to reach $495 billion by 2015, from roughly $266 million in 2010. Kombucha is a centuries-old Eastern beverage made from the fermentation of beneficial bacteria and yeast in tea. Increasing awareness of the benefits of probiotics and the tremendous appeal of kombucha can be seen in the growth of kombucha sales in the US, from $49 million in 2011 to $90 million in 2014. SPINS data shows that in the 52-week period to February 2014, kombucha scans totaled $122.7 million *FirstBev.com
Bottled/Sparkling Water
Consumption of bottled water has increased over the last decade as US sales of carbonated soft drinks, particularly colas, have steadily declined. Sparkling water is one of the smaller product segments in the bottled water market, but it is leading the industry in annual growth. Sales of sparkling water products jumped about 15% in 2015, compared to a 5% increase in sales of all types of bottled water. Sales in the segment are expected to rise by 75% from 2015 to 2020 as more consumers give up soft drinks for healthier alternatives. *Hoovers/Mintel
Business Challenges:
Slowing Demand
S sales of carbonated soft drinks have steadily declined since 2005. Instead, consumers are also drinking more bottled water, energy and sports drinks, and ready-to-drink teas.
Health Concerns
Several health groups contend that the high sugar content in soft drinks contributes to the obesity epidemic among US children. As a result, federal and state governments often discuss imposing taxes on sweetened beverages. Manufacturers are also facing increased scrutiny related to diet soda, particularly for artificial sweeteners like aspartame. *Hoovers
Decline of Diet
Sales of diet soda are dropping as consumers shy away from aspartame and other artificial sweeteners. North American sales of artificially sweetened diet products fell 12% from 2013 to 2015, a larger decline than carbonated soft drinks overall, which dropped 8% in that period. *Nielsen/Hoovers.
Trends & Opportunities:
Healthy Alternatives
Beverage companies are offering a growing variety of healthy items such as meal replacements, dairy alternatives, and drinks loaded with vitamins and minerals. Manufacturers like Monster Beverage and PepsiCo (maker of Naked Juice) are producing refrigerated versions of smoothies for grocery and convenience stores. Other healthy beverages gaining popularity include coconut water, nutrition drinks for children, and vitamin drinks for older adults. *Hoovers
Smaller Portions
Offering smaller serving sizes can go far in reducing sugar and caloric intake. In 2014, the American Beverage Association pledged to cut calories by 20% by 2025. By serving smaller cans and bottles, soft drink makers can achieve this without necessarily cutting sugar from the recipe. *BusinessInsider
Private-Label
Private-label sodas continue to be popular with budget-minded consumers, mass merchandisers, and local supermarkets. Despite having lower retail prices than national brands, private-label sodas have higher margins for grocers because they don't have heavy marketing costs and they tend to be cheaper to produce. *Hoovers
Historical facts about Beverages:
- Some call it ‘Pop’. Some say “Soda.” The term “Soft Drinks” was developed as a catch-all for this category. They are called “Soft” because they don’t contain any alcohol (aka “hard drinks). *TheRichest.com
- In Tudor England 'water imperial' was widely drunk; it was a sweetened drink with lemon flavor and containing cream of tartar. *Britishsoftdrinks.com
- One of the first sodas created in the United States, Dr. Pepper was concocted by a drug store pharmacist in 1885 in Waco TX. When he wasn’t busy mixing medicines, he enjoyed serving local patrons at his soda fountain. Alderton always liked the sweet smell of the various medicines and fruit syrups that would permeate the air. He then set out to recreate that smell for a soft drink. Out of this process, Dr. Pepper was born. *DrPeppermuseum.com
- 7-Up was original called “Bib-Label Lithiated Lemon-Lime Soda. Lithiated, meaning it contained Lithium, a drug that is used to treat some mental illnesses, and relaxes the user and brings them down from their manic episodes. 7-Up contained the ingredient until 1948 when the government banned the use in soft drinks. *Gizmodo
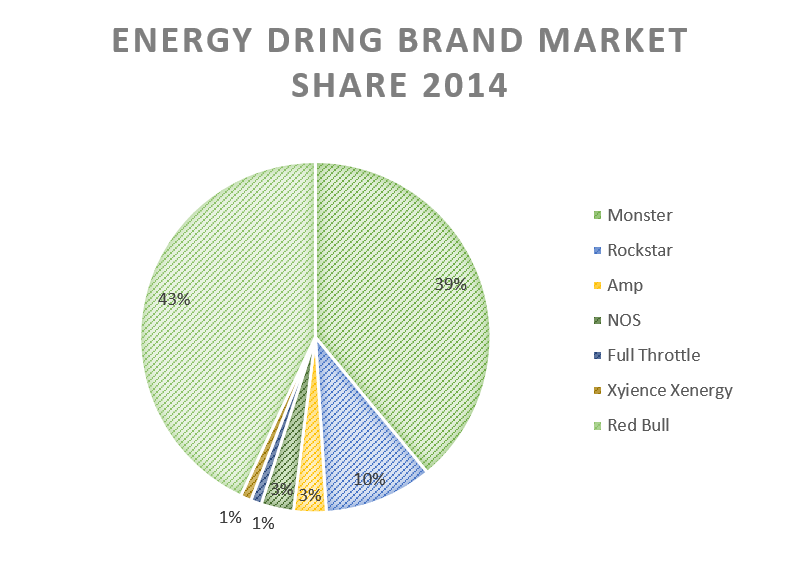
US energy drink market to grow by an estimated 52% from 2014 to 2019. *Mintel
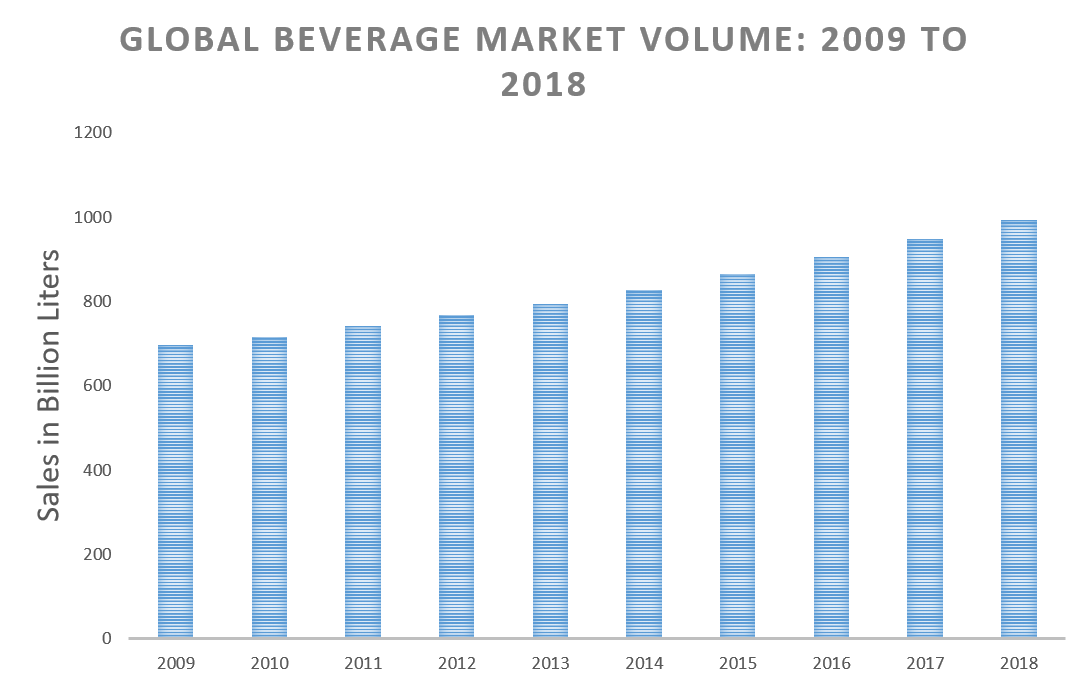
Global beverage market volume: 2009 to 2018. *Statista 2017