The Latest Trends in the Coffee, Tea and Cocoa Categories 12/1/2016
“Hot” Facts
- Tea is the most consumed beverage in the world *U.N. Food and Agriculture Organization
- Typical customers in the consumer segment include grocery stores, grocery wholesalers, mass merchandisers, warehouse clubs, drugstores, and specialty food stores.
- The industry is capital-intensive: average annual revenue per worker is about $750,000 *Hoovers 2016
- Daily consumption of espresso-based beverages has nearly tripled since 2008
- Between 2008 and 2016, past-day consumption of gourmet coffee beverages soared from 13% to 36% among 18-24 year olds, and from 19% to 41% for those 25-39.
- For espresso-based beverages alone, the jump becomes 9% to 22% for the 18-24 group and 8% to 29% for those 25-39. *National Coffee Association 2016
By the Numbers
- 6 Billion: Worldwide cups of tea consumed per day *U.N. Food and Agriculture Organization
- 10%: Consumers who prefer decaf coffee *NCA
- $1092: USD per year American consumers spend on coffee *USAToday 2014
- 880 Gallons: Largest hot cocoa ever made in 2013 at Tampa Bay’s Museum of Science *Guiness World Records
Industry Breakdown
Major Coffee Companies:
Cocoa Overview
The global chocolate powder drinks market is worth approximately US$6 billion and emerging markets account for over half of retail sales. Nestlé’s is the leader with brands like Nesquik, Nescau and Dancow. Nesquik is the world’s largest brand, with retail sales of US$850 million in 2014, followed by Nescau, at US$620 million. *Euromonitor
- US producers - Farmer Bros, Keurig Green Mountain, JM Smucker (owner of Folgers), and Kraft Heinz (owner of Maxwell House).
- International: Nestlé (Switzerland), Tata Global Beverages (India), and Unilever, the UK-based owner of Lipton
Cocoa Overview
The global chocolate powder drinks market is worth approximately US$6 billion and emerging markets account for over half of retail sales. Nestlé’s is the leader with brands like Nesquik, Nescau and Dancow. Nesquik is the world’s largest brand, with retail sales of US$850 million in 2014, followed by Nescau, at US$620 million. *Euromonitor
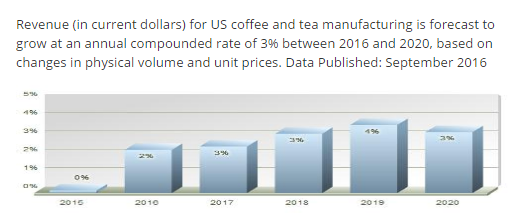
Industry Forecast
Trends & Opportunities
- US personal income, a driver of consumer demand for coffee and tea, rose 3.1% in August 2016 compared to August 2015.
- US retail sales for food services and drinking places increased 6.4% in the first nine months of 2016 compared to the same period in 2015.
- Since 2010, consumers have had more spending money and, thus, have been willing to spend it on nonessential beverages like cocoa and drinking chocolate, boosting industry revenue *Hoovers 2016
- The global chocolate powder drinks market is forecast to see a net growth of around US$800 million in 2014-2019. *Euromonitor 2016
Trends & Opportunities
Be Special — The “Indulgence Trend” drives the demand for specialty coffee. *Global Industry Analysts 2016 Specialty coffee represents 48% of the coffee consumed in the US. Growth in the coffee business is being driven by an increase in coffeehouses and the availability of specialty coffee. Interest in specialty tea also continues to grow. *SCAA
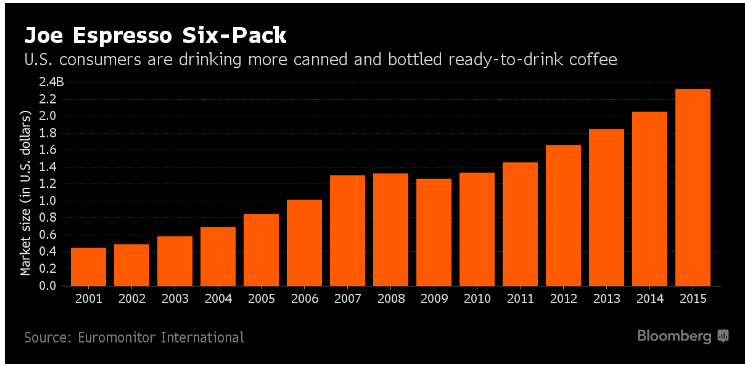
Go Cold – The National Coffee Association reports 15% of coffee drinkers tried cold brew in 2015. For the fourth quarter of 2015, Starbucks reported a 20 percent increase in iced drink sales nationwide following its introduction of a new cold brew coffee in its retail stores. *Bloomberg 2016 The U.S. ready-to-drink coffee market has been growing by double digits annually since 2011, and the market could reach nearly $3.6 billion by 2020. *Euromonitor International
Go Decaf — New processes have improved the flavor of decaf coffee and many consumers often switch to decaf for health reasons as they age. By providing decaffeinated options, companies can prevent some consumers from switching to alternative beverages and preserve brand loyalty. *Hoovers
Go Green — Interest in health has driven sales for organic coffee and tea. Organic coffee sales have been rising steadily over the last 10 years as a growing number of consumers look to organic products as an alternative to conventionally grown foods. *Hoovers 2016
Single-Cup Brew – Household ownership of single-cup brewing machines reached 27% in 2015 – an all-time high. Ownership was a mere 7% in 2011 and 15% in 2014. *NCA
Certifications —Imports of Fair Trade coffee into the US and Canada grew nearly 20% in 2012 compared to 2011. *Fair Trade USA. Companies buy Fair Trade coffee at a set price, regardless of market conditions, to ensure a sustainable business for small growers. The most popular purchased coffee certifications are Organic (25%); Fair Trade (18%); and Rainforest Alliance (16%). *NCA 2016
“Organic Coffee: Aims to promote and enhance natural soil activity and cycling of resources, which helps to create a rich and fertile substrate for the crop and maintain ecological balance by prohibiting use of artificially produced (synthetic) agrochemicals.” *University of Florida
“Fair Trade: Fair Trade Certified™ products were made with respect to people and planet. Our rigorous social, environmental and economic standards work to promote safe, healthy working conditions, protect the environment, enable transparency, and empower communities to build strong, thriving businesses.” *Fairtradeusa.org
“Rainforest Alliance: Coffee is grown on farms where forests, rivers, soils, and wildlife are conserved and workers are treated with respect, paid decent wages, have proper and safe equipment, and are given access to education and medical care. *Rainforest Alliance
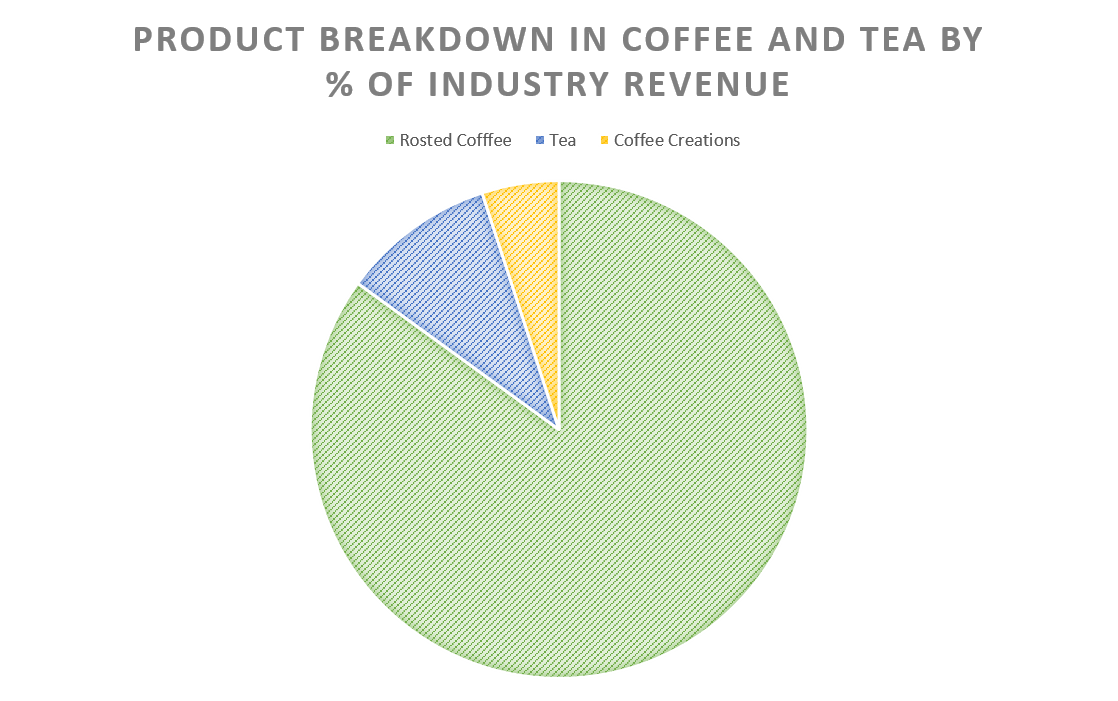
Product Breakdown in Coffee & Tea by % of industry revenue
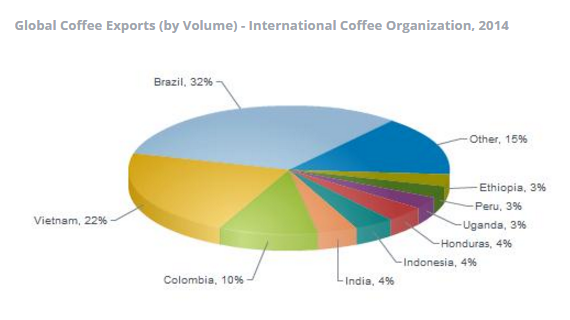
*International coffee Organization 2014
*First Research 2016
*Euromonitor International
*Fairtradeusa.org
*Rainforest Alliance